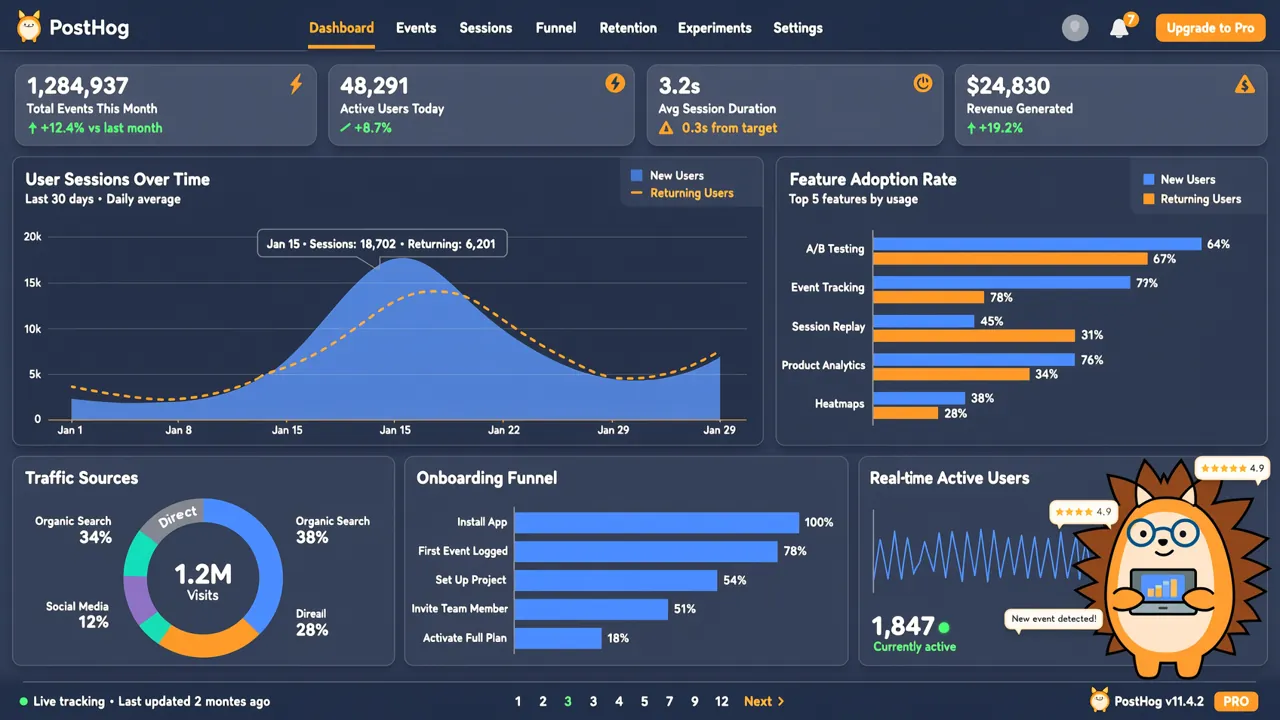
Qu'est-ce que PostHog ?
PostHog est actuellement la plateforme d'analyse produit et d'observabilité IA open source la plus populaire sur GitHub (⭐ plus de 19 000 stars). Contrairement aux outils fermés comme Google Analytics, PostHog combine analyse produit, suivi du comportement utilisateur, expérimentations A/B, feature flags et suivi d'erreurs dans une seule plateforme open source unifiée. Vos données restent entièrement sous votre contrôle.
Pourquoi les développeurs choisissent PostHog ?
| Dimension | Google Analytics | Mixpanel | PostHog |
|---|---|---|---|
| Open source / self-hosted | ❌ | ❌ | ✅ MIT License |
| Propriété des données | Appartient à Google | Appartient à Mixpanel | Vous appartient |
| Session Replay | ❌ | ✅ Payant | ✅ Intégré |
| Feature Flags | ❌ | ❌ | ✅ Intégré |
| Tests A/B | ❌ | ✅ Payant | ✅ Intégré |
| Observabilité IA | ❌ | ❌ | ✅ Suivi des appels LLM |
| Quota gratuit | Illimité (mais échantillonnage) | 1M événements/mois | 1M événements/mois |
| Tarification | Version entreprise coûteuse | Selon le volume | Après quota, au volume |
Le positionnement central de PostHog est d'aider les équipes produit et les développeurs à comprendre le comportement des utilisateurs pour piloter les décisions produit. Voici ce qui le différencie :
- Plateforme All-in-One : un seul outil pour l'analyse produit, l'analyse web, le session replay, les feature flags, les expérimentations, le suivi d'erreurs, les logs et les sondages
- Observabilité IA : suivi de la latence, du coût et du contenu généré par les appels LLM — un atout différenciant en 2026
- Intégration MCP : connexion aux outils de codage IA comme Claude Code ou Cursor via le protocole MCP, pour consulter les données directement dans l'éditeur
- Mode Self-driving : détection automatique des rage clicks, erreurs et requêtes échouées, avec génération de rapports d'analyse et de PR
Différences d'architecture entre PostHog et les autres solutions
┌─────────────────────────────────────────────────┐
│                   PostHog                        │
├──────────┬──────────┬──────────┬────────────────┤
│ Analyse  │ Replay   │ Feature  │ Observabilité  │
│ produit  │ sessions │ Flags    │ IA (LLM)       │
│ (Events) │ (Replay) │ (Flags)  │ (LLM Traces)   │
├──────────┴──────────┴──────────┴────────────────┤
│         Moteur de données ClickHouse unifié       │
├──────────────────────────────────────────────────┤
│        SDK Frontend | SDK Backend | API | MCP    │
└──────────────────────────────────────────────────┘
Déployer PostHog en self-hosted
Option 1 : PostHog Cloud (recommandé)
Le moyen le plus rapide de commencer, sans aucune maintenance :
- PostHog Cloud US — Pour les utilisateurs hors Europe
- PostHog Cloud EU — Pour les utilisateurs européens soucieux de la conformité des données
Le quota gratuit mensuel inclut : 1 million d'événements, 5 000 recordings, 1 million de requêtes Flag, 10 000 exceptions.
Option 2 : Déploiement Docker en une commande (self-hosted)
Si vous voulez un contrôle total sur vos données, PostHog propose un plan Hobby extrêmement simple à déployer.
Prérequis : - Serveur Linux - Au moins 4 Go de RAM - Docker + Docker Compose
Déploiement en une ligne :
/bin/bash -c "$(curl -fsSL https://raw.githubusercontent.com/posthog/posthog/HEAD/bin/deploy-hobby)"
Une fois le déploiement terminé, accédez à http://localhost:8000 pour voir l'interface d'administration PostHog.
Option 3 : Déploiement manuel avec Docker Compose
Si vous avez besoin d'un contrôle plus fin :
# docker-compose.yml
version: '3.8'

services:
  posthog:
    image: posthog/posthog:latest
    ports:
      - "8000:8000"
    environment:
      - DATABASE_URL=postgres://posthog:posthog@db:5432/posthog
      - REDIS_URL=redis://redis:6379/
    depends_on:
      - db
      - redis

  db:
    image: postgres:15
    environment:
      POSTGRES_PASSWORD: posthog
    volumes:
      - pgdata:/var/lib/postgresql/data

  redis:
    image: redis:7

volumes:
  pgdata:
# Lancer les services
docker-compose up -d

# Voir les logs
docker-compose logs -f posthog
⚠️ Note : Pour la version open source en self-hosted, il est recommandé de rester sous 100 000 événements/mois. Au-delà, migrez vers PostHog Cloud.
Prise en main rapide : connecter votre première application
Connexion avec le SDK JavaScript (Frontend)
Installez le SDK :
npm install posthog-js
Initialisez-le dans votre point d'entrée :
import posthog from 'posthog-js';

posthog.init('VOTRE_CLE_API_POSTHOG', {
  api_host: 'https://us.posthog.com',  // Pour le self-hosted : http://votre-serveur:8000
  autocapture: true,  // Capture automatique de tous les clics, pages vues, etc.
});

// Envoyer manuellement un événement personnalisé
posthog.capture('user_signed_up', {
  method: 'email',
  plan: 'free',
});

// Définir l'identité de l'utilisateur (à appeler lors de la connexion)
posthog.identify('user-unique-id-123', {
  email: 'developer@example.com',
  name: 'Zhang San',
});
Avec autocapture: true, vous n'avez besoin d'ajouter aucun code de tracking — tous les clics sur les boutons, les liens et les soumissions de formulaire sont enregistrés automatiquement.
Connexion avec le SDK Python (Backend)
Pour les événements côté serveur (paiement réussi, commande créée) :
pip install posthog
from posthog import Posthog

# Initialisation (stockez la clé API dans une variable d'environnement)
posthog = Posthog(
    project_api_key='VOTRE_CLE_API_PROJET',
    host='https://us.posthog.com'
)

# Capturer un événement
posthog.capture(
    distinct_id='user-unique-id-123',
    event='payment_completed',
    properties={
        'amount': 99.00,
        'currency': 'USD',
        'payment_method': 'stripe',
    }
)

# Définir les attributs utilisateur
posthog.identify(
    distinct_id='user-unique-id-123',
    properties={
        'email': 'developer@example.com',
        'plan': 'pro',
        'company': 'TechCorp',
    }
)

# Fermer le client (à la fermeture de l'application)
posthog.shutdown()
Connexion dans un projet Next.js (Full-stack)
npm install posthog-js posthog-node
// components/PostHogProvider.tsx
import { PostHogProvider as PHProvider } from 'posthog-js/react';
import { useEffect, useState } from 'react';
import posthog from 'posthog-js';

export function PostHogProvider({ children }: { children: React.ReactNode }) {
  const [clientReady, setClientReady] = useState(false);

  useEffect(() => {
    posthog.init(process.env.NEXT_PUBLIC_POSTHOG_KEY!, {
      api_host: process.env.NEXT_PUBLIC_POSTHOG_HOST || 'https://us.posthog.com',
      person_profiles: 'identified_only',
    });
    setClientReady(true);
  }, []);

  if (!clientReady) return null;
  return <PHProvider client={posthog}>{children}</PHProvider>;
}
// app/layout.tsx
import { PostHogProvider } from '@/components/PostHogProvider';

export default function RootLayout({ children }) {
  return (
    <html lang="fr">
      <body>
        <PostHogProvider>{children}</PostHogProvider>
      </body>
    </html>
  );
}
// app/page.tsx
'use client';
import { usePostHog } from 'posthog-js/react';

export default function HomePage() {
  const posthog = usePostHog();

  return (
    <button onClick={() => {
      posthog.capture('cta_clicked', {
        cta_text: 'Essai gratuit',
        page: 'homepage',
      });
    }}>
      Commencer l'essai gratuit
    </button>
  );
}
Fonctionnalités clés en pratique
1. Analyse produit : comprendre le comportement des utilisateurs
Une fois les données connectées, PostHog génère automatiquement des graphiques de tendances, des analyses de funnel et des courbes de rétention.
Exemple de funnel : Inscription → Activation → Paiement
-- PostHog permet des requêtes SQL directes (ClickHouse)
SELECT
    event,
    COUNT(DISTINCT distinct_id) as users
FROM events
WHERE event IN ('user_signed_up', 'feature_activated', 'payment_completed')
  AND timestamp > now() - INTERVAL 30 DAY
GROUP BY event
ORDER BY timestamp
Dans l'interface PostHog :
1. Allez dans Product Analytics → Funnels
2. Ajoutez les étapes : user_signed_up → feature_activated → payment_completed
3. Consultez le taux de conversion à chaque étape
Analyse de rétention :
1. Allez dans Product Analytics → Retention
2. Sélectionnez l'événement initial (ex. user_signed_up) et l'événement de retour (ex. pageview)
3. Consultez les courbes de rétention J1/J7/J30
2. Session Replay : voir les actions réelles des utilisateurs
Le Session Replay vous montre les enregistrements des sessions utilisateurs : mouvements de souris, scroll, clics.
Configuration :
posthog.init('VOTRE_CLE_API', {
  api_host: 'https://us.posthog.com',
  session_recording: {
    maskAllInputs: false,  // Ne masque pas le contenu des champs (mettre true pour les scénarios sensibles à la vie privée)
    recordCrossOriginIframes: true,
  },
});
Identifier les Rage Clicks (clics de frustration) :
// Quand un utilisateur clique rapidement sur le même élément plus de 5 fois, un événement rage click est déclenché
posthog.onFeatureFlags(() => {
  posthog.capture('rageclick', {
    element: document.activeElement.tagName,
    page: window.location.pathname,
  });
});
Dans le dashboard PostHog, vous pouvez : 1. Filtrer toutes les sessions contenant un rage click 2. Regarder directement le replay pour identifier le problème d'interface qui frustre les utilisateurs 3. Créer un Issue et l'assigner à l'équipe de développement en un clic
3. Feature Flags : déploiement progressif en toute sécurité
Les Feature Flags vous permettent de contrôler l'activation des fonctionnalités sans déployer de code :
// Vérifier si une fonctionnalité est accessible à un utilisateur
posthog.onFeatureFlags(() => {
  const newDashboard = posthog.getFeatureFlag('new-dashboard');

  if (newDashboard) {
    // Afficher le nouveau dashboard
    renderNewDashboard();
  } else {
    // Garder l'ancienne version
    renderOldDashboard();
  }
});
Créer un déploiement expérimental :
// Ciblage selon les attributs utilisateur
posthog.capture('feature_viewed', {
  $feature_flag: 'beta-search',
  $feature_flag_response: true,
});
Dans l'interface PostHog :
1. Allez dans Feature Flags → Create Flag
2. Définissez le nom beta-search
3. Choisissez la stratégie de déploiement :
- Déploiement complet (100% des utilisateurs)
- Déploiement partiel (ex. 10% des utilisateurs)
- Déploiement ciblé (par domaine email, groupe d'utilisateurs)
4. Après sauvegarde, le SDK applique automatiquement les changements, sans redéploiement
4. Tests A/B : décisions pilotées par les données
Les tests A/B vous permettent de valider statistiquement l'impact de vos modifications.
// Code d'expérimentation
posthog.onFeatureFlags(() => {
  const experiment = posthog.getFeatureFlag('landing-page-test');

  if (experiment === 'variant-a') {
    showVariantA();
  } else if (experiment === 'variant-b') {
    showVariantB();
  }

  // Enregistrer l'exposition à l'expérience
  posthog.capture('experiment_exposure', {
    $feature_flag: 'landing-page-test',
    variant: experiment,
  });
});
Créer une expérience dans PostHog :
1. Allez dans Experiments → Create Experiment
2. Sélectionnez le Feature Flag correspondant
3. Définissez la métrique cible (ex. l'événement payment_completed)
4. Fixez le niveau de significativité (généralement 95%)
5. Lancez l'expérience et attendez un résultat statistiquement significatif
PostHog calcule automatiquement la valeur p, l'intervalle de confiance et la probabilité de victoire.
5. Suivi d'erreurs : capture automatique des exceptions frontend
import posthog from 'posthog-js';

posthog.init('VOTRE_CLE_API', {
  api_host: 'https://us.posthog.com',
  capture_performance: true,
});

// Capture automatique des erreurs non interceptées
window.addEventListener('error', (event) => {
  posthog.capture('frontend_error', {
    error_message: event.message,
    error_url: event.filename,
    error_line: event.lineno,
    error_col: event.colno,
    stack: event.error?.stack,
  });
});

// Capture des rejets de promesses non gérés
window.addEventListener('unhandledrejection', (event) => {
  posthog.capture('promise_rejection', {
    error_message: event.reason?.message || String(event.reason),
  });
});
Dans la page Error Tracking de PostHog, vous pouvez : - Voir la tendance de fréquence des erreurs - Associer les erreurs aux recordings de session concernés - Configurer des alertes (ex. notification Slack si plus de 100 erreurs en une journée)
6. Observabilité IA : suivre les appels LLM
C'est la fonctionnalité phare de PostHog en 2026, conçue spécialement pour les développeurs d'applications IA.
Suivre les appels OpenAI avec le SDK Python :
pip install posthog openai
from posthog import Posthog
import openai

posthog = Posthog('VOTRE_CLE_API', host='https://us.posthog.com')

def generate_with_tracking(user_id: str, prompt: str):
    import time
    start = time.time()

    response = openai.ChatCompletion.create(
        model="gpt-4",
        messages=[{"role": "user", "content": prompt}]
    )

    latency = time.time() - start
    tokens_used = response.usage.total_tokens

    # Suivi de l'appel LLM
    posthog.capture(
        distinct_id=user_id,
        event='llm_call_completed',
        properties={
            'model': 'gpt-4',
            'prompt_length': len(prompt),
            'response_length': len(response.choices[0].message.content),
            'tokens_used': tokens_used,
            'latency_ms': latency * 1000,
            'success': True,
        }
    )

    return response
Suivre avec LangChain :
from langchain.callbacks import PostHogCallbackHandler

handler = PostHogCallbackHandler(
    api_key='VOTRE_CLE_API',
    host='https://us.posthog.com',
    distinct_id='user-123',
)

# Utiliser dans une chain
chain = LLMChain(llm=llm, prompt=prompt, callbacks=[handler])
result = chain.run("Bonjour, peux-tu me présenter PostHog ?")
Dans le dashboard PostHog, vous pouvez voir : - La distribution de latence de chaque appel LLM - La consommation de tokens et les statistiques de coût - Les causes d'erreur des requêtes échouées - Les modèles d'appel groupés par utilisateur
Intégration MCP : consulter les données dans l'éditeur
PostHog prend en charge le protocole MCP. Vous pouvez interroger directement vos données produit depuis Claude Code, Cursor et d'autres outils.
Configuration MCP (Claude Code) :
// .mcp.json
{
  "mcpServers": {
    "posthog": {
      "command": "npx",
      "args": ["-y", "@posthog/mcp"],
      "env": {
        "POSTHOG_API_KEY": "phc_votre_cle_api",
        "POSTHOG_PERSONAL_API_KEY": "phx_votre_cle_personnelle",
        "POSTHOG_PROJECT_ID": "12345",
        "POSTHOG_API_HOST": "https://us.posthog.com"
      }
    }
  }
}
Une fois configuré, vous pouvez poser des questions directement dans Claude Code :
> Combien d'utilisateurs se sont inscrits ces 7 derniers jours ?
> Montre-moi le funnel de conversion pour la page /dashboard
> Quelle page a eu le plus de rage clicks hier ?
Questions fréquentes
La version gratuite de PostHog est-elle suffisante ?
Pour la plupart des développeurs indépendants et des petites équipes : 1 million d'événements + 5 000 recordings par mois, c'est largement suffisant. Pour un site SaaS classique, 1 million d'événements correspond à environ 50 000 à 100 000 utilisateurs mensuels actifs.
Quelle différence entre Cloud et self-hosted ?
| Cloud | Self-hosted | |
|---|---|---|
| Maintenance | Aucune | Nécessite Docker + gestion de la base de données |
| Localisation des données | Serveurs PostHog | Votre propre serveur |
| Exhaustivité des fonctionnalités | Toutes | Certaines fonctionnalités entreprise indisponibles |
| Échelle adaptée | Toute taille | ≤ 100 000 événements/mois |
| Prix | Quota gratuit + au volume | Coût du serveur |
PostHog a-t-il un impact important sur les performances ?
Le SDK JavaScript se charge de manière asynchrone et n'affecte pas le rendu de la page. Le SDK backend utilise une file d'attente avec envoi par lots, sans impact sur la logique métier.
PostHog est-il compatible avec la vie privée (RGPD/PIPL) ?
Oui. L'instance PostHog EU est conforme au RGPD. Pour le marché chinois, vous pouvez utiliser maskAllInputs et des règles de filtrage de données personnalisées pour vous conformer au PIPL.
Résumé
PostHog est la plateforme d'analyse produit open source la plus complète actuellement. Un seul outil remplace la combinaison Google Analytics + Hotjar + LaunchDarkly + Optimizely + Sentry. Pour les développeurs et les équipes produit, le contrôle total des données et l'expérience tout-en-un constituent la plus grande valeur ajoutée.
Ressources clés : - Site officiel PostHog - Repository GitHub ⭐ 19 000+ - Centre de documentation - Guide de déploiement - Manuel de l'entreprise (open source)
Si cet article vous a été utile, n'hésitez pas à le partager avec d'autres développeurs !